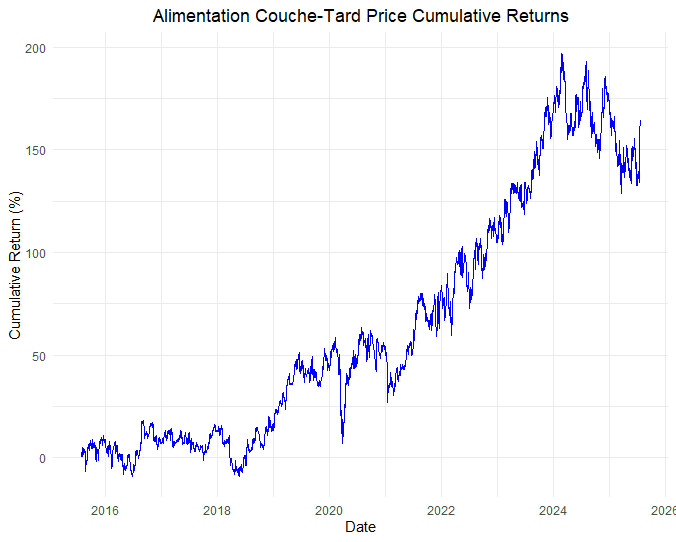
Figure: Alimentation Couche-Tard (ATD.TO) Daily Closing Stock Price Cumulative Return in Percent for Last 10 years. The total return of Alimentation Couche-Tard stock closing price for the last 10 years as of July 23, 2025, was 162.75%.
Dividend investing has long been a cornerstone strategy for building sustainable, long-term wealth. Among the most trusted and resilient income-generating assets are Canadian Dividend Aristocrats companies that have consistently increased their dividends for five or more consecutive years. But selecting the right dividend stock isn’t just about past performance; it’s about forecasting future growth.
In this blog, we’ll highlight 11 Canadian Dividend Aristocrats, providing key financial metrics that are crucial for evaluating their investment potential. These metrics include Market Cap, Forward Dividend & Yield, Profit Margin, Revenue, Total Cash, and Total Debt.
Why Focus on Financial Highlights?
Before diving into forecasting models like ARIMA, SARIMA, ETS, TSLM, or Prophet for predicting stock price trends and dividend growth, it’s essential to understand the current financial health of these companies. Metrics such as profit margins, cash reserves, and dividend yields are foundational indicators that complement time series forecasts.
Most of the sources are from Yahoo Finance as of July 24, 2025. Note that if not mentioned, total cash and debt were (mrq).
Stock Highlights and Financial Summary
1. Royal Bank of Canada (RY.TO)
Canada’s largest bank by market capitalization, RBC, offers a range of diversified financial services, including personal and commercial banking, wealth management, insurance, and capital markets services.
- Market Cap (Intraday): CAD 254.871B
- Forward Dividend & Yield: CAD 6.16 (3.38%)
- Profit Margin: 31.33%
- Revenue (TTM): CAD 58.14 B
- Total Cash (mrq): CAD 791.87B
- Total Debt (mrq): 489.41B
2. Toronto-Dominion Bank (TD.TO)
TD Bank is one of Canada’s Big Five banks, recognized for its strong retail banking presence in both Canada and the United States, as well as its growing wealth management division.
- Market Cap (Intraday): CAD 176.382B
- Forward Dividend & Yield: CAD 4.20 (4.10%)
- Profit Margin: 27.93%
- Revenue (TTM): CAD 62.22B
- Total Cash (mrq): CAD 641.51B
- Total Debt (mrq): 495.06B
3. Great-West Lifeco (GWO.TO)
A leading insurance and financial services holding company, Great-West Lifeco offers life and health insurance, retirement savings, and wealth management services in Canada, the US, and Europe.
- Market Cap (Intraday): CAD 49.155B
- Forward Dividend & Yield: CAD 2.44 (4.64%)
- Profit Margin: 11.38%
- Revenue (TTM): CAD 34.88B
- Total Cash (mrq): CAD 187.78B
- Total Debt (mrq): CAD 9.54B
4. Fortis Inc. (FTS.TO)
Fortis is a North American leader in electric and gas utilities, with operations in Canada, the US, and the Caribbean, focusing on long-term regulated utility investments.
- Market Cap (Intraday): CAD 33.552B
- Forward Dividend & Yield: CAD 2.46 (3.71%)
- Profit Margin: 14.69%
- Revenue (TTM): CAD 11.73B
- Total Cash: CAD 510M
- Total Debt: CAD 34.4B
5. Emera Inc. (EMA.TO)
Emera is a diversified energy and services company primarily invested in regulated electricity generation and transmission in Canada, the US, and the Caribbean.
- Market Cap (Intraday): CAD 19B
- Forward Dividend & Yield: CAD 2.90 (4.58%)
- Profit Margin: 12.00%
- Revenue (TTM): CAD 7.86B
- Total Cash: CAD 308M
- Total Debt: CAD 20.08B
6. Enbridge Inc. (ENB.TO)
Enbridge is North America’s largest energy infrastructure company, operating pipelines that transport oil and natural gas, as well as renewable energy assets.
- Market Cap (Intraday): CAD 135.075B
- Forward Dividend & Yield: CAD 3.77 (6.10%)
- Profit Margin: 10.33%
- Revenue (TTM): CAD 60.94B
- Total Cash: CAD 2.1B
- Total Debt: CAD 103.22B
7. Alimentation Couche-Tard (ATD.TO)
One of the world’s largest convenience store operators, Couche-Tard owns brands like Circle K and operates over 14,000 stores worldwide.
- Market Cap (Intraday): CAD 71.219B
- Forward Dividend & Yield: CAD 0.78 (1.02%)
- Profit Margin: 3.54%
- Revenue (TTM): CAD 72.86B
- Total Cash: CAD 2.3B
- Total Debt: CAD 14.09B
8. Canadian National Railway (CNR.TO)
CNR is Canada’s largest railway company, providing freight transportation services across North America, playing a vital role in trade and logistics.
- Market Cap (Intraday): CAD 81.689B
- Forward Dividend & Yield: CAD 3.55 (2.60%)
- Profit Margin: 26.20%
- Revenue (TTM): CAD 17.2B
- Total Cash: CAD 233M
- Total Debt: CAD 21.26B
9. CT REIT (CRT-UN.TO)
CT REIT owns and operates a portfolio of income-producing properties, primarily leased to Canadian Tire Corporation, offering stable and predictable rental income.
- Market Cap (Intraday): CAD 3.763B
- Forward Dividend & Yield: CAD 0.95 (5.98%)
- Profit Margin: 34.49%
- Revenue (TTM): CAD 584.86M
- Total Cash: CAD 3.17M
- Total Debt: CAD 3.07B
10. Exchange Income Corp (EIF.TO)
Exchange Income Corp operates in aerospace and aviation services and manufacturing, providing diversified revenue streams through its subsidiaries.
- Market Cap (Intraday): CAD 3.378B
- Forward Dividend & Yield: CAD 2.64 (4.00%)
- Profit Margin: 4.55%
- Revenue (TTM): CAD 2.73B
- Total Cash: CAD 54.17M
- Total Debt: CAD 2.28B
11. Keyera Corp (KEY.TO)
Keyera is a leading Canadian energy infrastructure company engaged in natural gas processing, transportation, and marketing of natural gas liquids.
- Market Cap (Intraday): CAD 9.771B
- Forward Dividend & Yield: CAD 2.08 (4.85%)
- Profit Margin: 7.40%
- Revenue (TTM): CAD 7.38B
- Total Cash: CAD 105.53M
- Total Debt: CAD 3.89B
📌 Why These Metrics Matter
- Market Cap reveals company scale and stability
- Forward Dividend Yield signals expected income
- Profit Margin & Revenue reflect operational efficiency
- Total Cash indicates financial flexibility and resilience
I use these key metrics to screen each stock before applying time‑series models for forecasting. Want to forecast their future trajectories? That’s exactly what Book 1 of the Book Series shows you how to do.
📗 Want a complete data table + forecasted projections?
Book 2: Preparing Data for Dividend Stock Forecasting Models walks you through how to:
- Collect and clean data for all 11 Canadian Dividend Aristocrats
- Conduct exploratory analysis using R
- Apply forecasting models like ARIMA, ETS, Prophet, TSLM
- Generate projections over 1-, 5-, 10-, 15-, and 20-year periods
🔗 Learn more or purchase Book 1
🔗 Stay tuned for Book 2 coming soon
📊 What’s Next? Calculating Cumulative Returns for These Dividend Stocks
In the next blog, I’ll walk you through how to calculate the cumulative returns of each of these 11 Canadian Dividend Aristocrats using R. We’ll track how an investment grows over time for each stock, visualize their performance trends, and see how these dividend-paying giants have rewarded long-term investors in the Book Series.
By leveraging time series analysis techniques and data visualization, we’ll set the foundation for building a robust dividend stock forecasting model.
🔔 Stay tuned for the next post where we dive into the cumulative performance analysis and uncover valuable insights for dividend growth investing.
Subscribe to Get Forecast Trends and Projections
If you’d like to receive exclusive model forecasts and long-term projections tracking over 90 Canadian Dividend Aristocrat stocks through Index ETFs, join my mailing list today.
You’ll get:
- Forecast updates and insights.
- Exclusive case studies.
- Free resources on DIY investment strategies.
👉 Join our mailing list today


Get the Full Framework in My New Book
This blog is based on my book “Foundations of Time Series Forecasting for Canadian Dividend Stocks”, which provides a step-by-step guide to forecasting dividend stocks using R and advanced statistical models.
Watch out for 📗 Book 2 – Preparing Data for Dividend Stocks Forecasting Models and 📙Book 3 – Building and Validating Dividend Stock Forecasting Models. Get your copies as soon as they are published.