Introduction: Why Your 2025 Assessment Matters More Than Ever
The City of Calgary’s annual property assessment is more than just a number; it’s the foundation for your property tax and a critical indicator of neighbourhood health and economic confidence.
At Cuttell Analytics, we’ve gone beyond the standard press release. This report combines a detailed examination of the current 2025 property assessment values with an extensive analysis of two decades of historical assessments (2005–2024). By integrating this data, we provide a holistic view of where Calgary’s real estate market has been and, more importantly, where our analysis suggests it is heading over the next five years.
Whether you’re a long-term homeowner, a first-time buyer, or an investor, understanding the trends revealed here is essential for planning your next move.
Section 1: The 2025 Snapshot – Key Takeaways from the New Assessment
The 2025 assessment reflects a dynamic and complex market. Unlike previous years, which were dominated by singular factors (such as oil price shocks or COVID-19 stimulus), this year’s numbers show differential growth, heavily favouring specific property classes and geographical areas.
Residential vs. Non-Residential Shifts
The data clearly indicates a continued pressure on property values, with a city-wide increase of 7.13% for the 2025 assessment cycle of the total assessed value from 2024. The residential class total assessed value increased by 17.3% year-over-year, while the non-residential class decreased by 15.53%. The residential market has continued to increase since 2021, likely from the development of new communities and infill development. Conversely, certain sectors of the non-residential market, particularly downtown office spaces, show signs of stabilization or even decline, indicating a critical need for diversified investment.
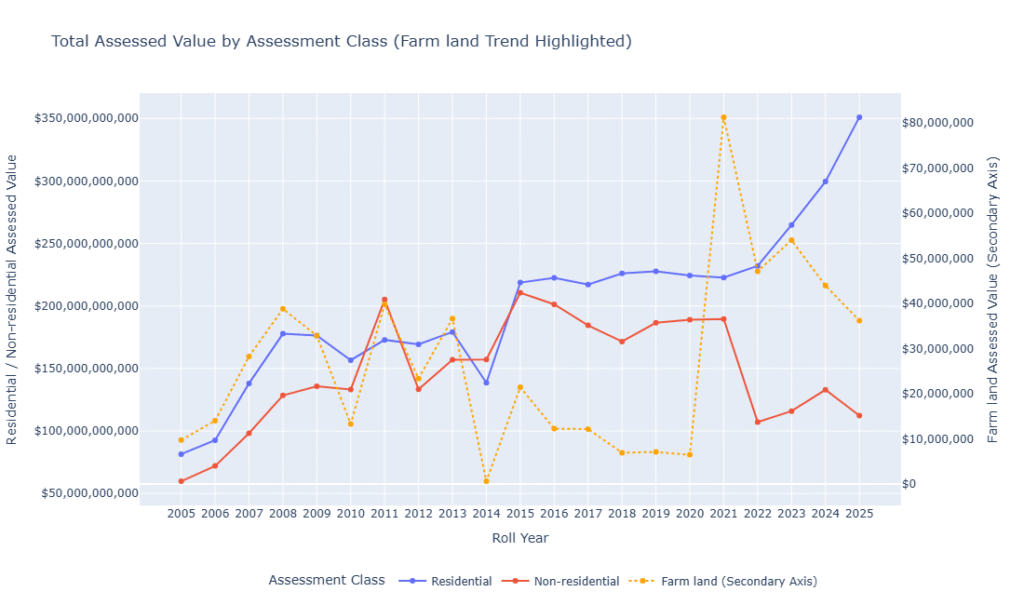
The following figures, Figures 1 and 2, show the Yearly Total Assessed Value by Assessment Class -Figure 1 and Total Assessed Value by Assessment Class (Farm-land Trend Highlighted) – Figure 2.
Both are the same plot where the farm-land total assessed value was plotted on the secondary y-axis.
Figure 1 – Yearly Total Assessed Value by Assessment Class
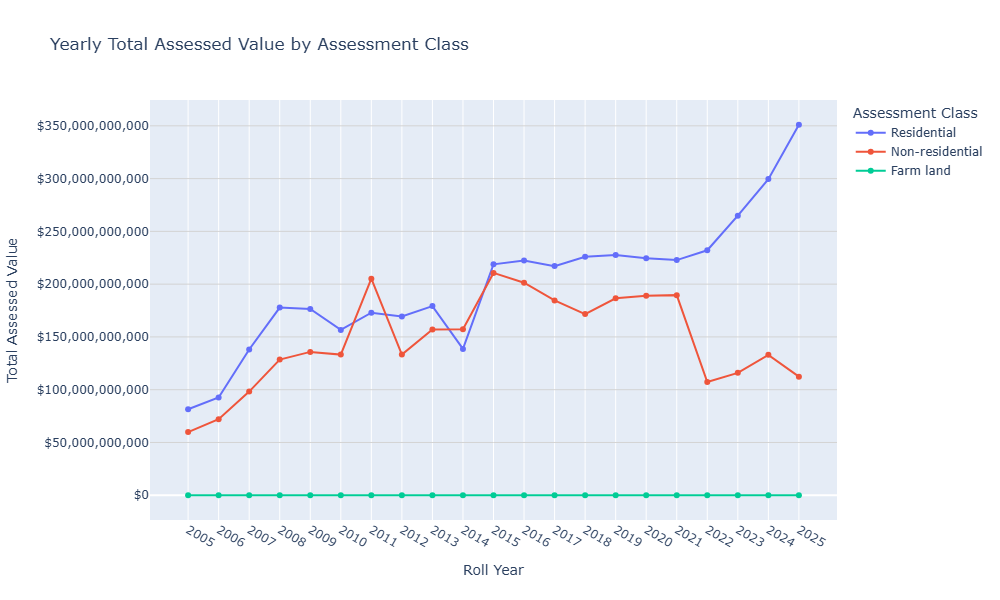
Figure 2 – Total Assessed Value by Assessment Class (Farm-land Trend Highlighted)
Top-Performing Communities (2024 to 2025)
Our analysis highlights the communities that saw the most aggressive year-over-year growth in assessed value. These communities are driven by two main factors that typically affect Calgary’s real estate assessments: Volume Growth (New Construction) and Market Appreciation, which are seeing increases well above the municipal growth. I am showing the five communities. The aggressive Year-over-Year (YoY) growth in total assessed values. However, these could likely be the top 10 communities considering the explosive growth in new residential home building the recent years.
- Cornerstone: This top-performing community achieved 28.64% growth in 2025, largely driven by Volume Growth: New Construction and Development
- Saddle Ridge, Mahogany, and Cranston: Likewise, these 3 communities, being the top 3rd, 4th and 5th performing communities, had a substantial rise and growth of YoY this year, including 18%, 16.57% and 13.2% respectively, signalling high demand for Property Type, e.g., detached starter homes, other residential sub property types. Just like the top-ranked community, these 3 were also largely driven by Volume Growth: New Construction and Development
- West Springs: This top community was second in the top ranking and grew by 18.88% in 2025. For all five communities, especially those considered mature or highly desirable, like West Springs, general market conditions contribute significantly.
The aggressive Year-over-Year (YoY) growth in total assessed value for these five communities is driven by two main factors that typically affect Calgary’s real estate assessments: Volume Growth (New Construction) and Market Appreciation.
For these specific communities, Volume Growth is almost certainly the primary driver of their top rankings.
1. Volume Growth: New Construction and Development
The top four communities on your list (Cornerstone, Saddle Ridge, Mahogany, and Cranston) are among Calgary’s largest and newest master-planned communities. The massive dollar volume growth observed is predominantly caused by:
- Completion of New Units: Assessed value increases significantly as new residential units (houses, townhouses, condos) and commercial spaces are completed and added to the city’s tax roll for the first time. Since these are high-volume development areas, one year can see thousands of new units added.
- Phased Development: These large communities are built in multi-year phases. A high YoY change often indicates a year where several large new phases of development were completed and transferred from raw land assessment to full residential/commercial assessment.
Why Volume is Key
While YoY percentage growth often highlights market appreciation, the sheer dollar amount of change (ranging from $686 million to $815 million) for these communities indicates that the growth is dominated by adding new physical structures (volume) rather than just an increase in the value of existing structures (price).
2. Market Appreciation and Demand
For all five communities, especially those considered mature or highly desirable, like West Springs, general market conditions contribute significantly:
- Sustained Housing Demand: The period leading into the 2025 assessment saw high demand and low inventory across Calgary, particularly for single-family homes and desirable suburban products. This high demand pushed up the market value of existing homes, which is reflected in the new assessed value.
- Desirability and Amenities: Communities that have recently added significant amenities (schools, rec centres, new commercial hubs) become more desirable. West Springs, in particular, benefits from its proximity to major transportation routes and the mountains, sustaining high demand and driving appreciation higher than the city average.
- Inflation and Construction Costs: General inflation in labour and material costs also feeds into the assessed value of new and existing construction, contributing to higher assessed values across the board.
In summary, the aggressive growth is a powerful combination of rapid, ongoing development (Volume Growth) in the newer communities, amplified by strong market demand (Market Appreciation) city-wide.
The following table shows the Top 5 Communities by Aggressive Growth (Sorted by YoY Change %) – Table 1
| Community | 2024 Total Assessed Value | 2025 Total Assessed Value | YoY Change ($) | YoY Change (%) | |
| 1 | CORNERSTONE | $2,396,802,680 | $3,083,138,240 | $686,335,560 | 28.64% |
| 2 | WEST SPRINGS | $3,700,023,990 | $4,398,494,560 | $698,470,570 | 18.88% |
| 3 | SADDLE RIDGE | $4,429,110,300 | $5,226,203,800 | $797,093,500 | 18.00% |
| 4 | MAHOGANY | $4,924,138,530 | $5,739,824,640 | $815,686,110 | 16.57% |
| 5 | CRANSTON | $5,483,459,370 | $6,207,012,860 | $723,553,490 | 13.20% |
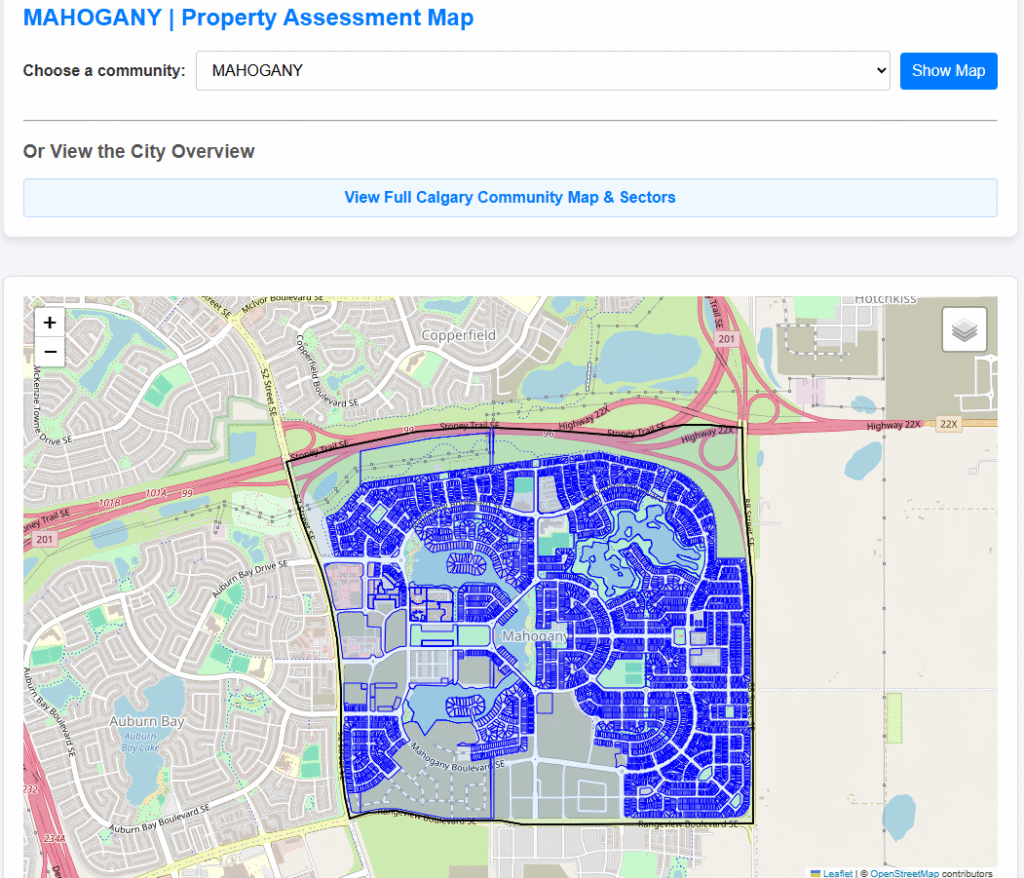
👉 Explore the Data: Use our Interactive Calgary Property Assessment Map to find your community, view the assessed values for every property, and see the boundary context that frames these market movements. https://cuttellanalytics.com/calgary-property-assessment-map/ or
Click Here to Analyze Your Community Now!
Section 2: Two Decades of Change (2005–2024)
To understand 2025, we must look at the long game. Our historical analysis traces the peaks and troughs of Calgary’s property market across two decades, a period encompassing major economic cycles.
This historical data provides the context necessary to identify true value anchors versus short-term market bubbles. Key periods identified:
- The Pre-2008 Boom (2005–2007): Characterized by rapid, double-digit annual assessment increases driven by the peak of the oil boom.
- The Mid-Cycle Correction and Stagnation (2015–2022): This period, clearly visible in the data, shows multiple years (from 2017 through 2022) of assessments broadly flatlining or declining, reflecting the sustained slump in commodity prices and the subsequent recovery lag.
- The Post-Pandemic Resurgence (2023–Present): A sharp return to growth driven by inter-provincial migration and housing scarcity.
Section 3: Decoding the Trends Through Data Visualization
By combining the 2005–2025 dataset, we gain deep insights into market momentum. The following charts, derived from our analysis, illustrate these complex dynamics.
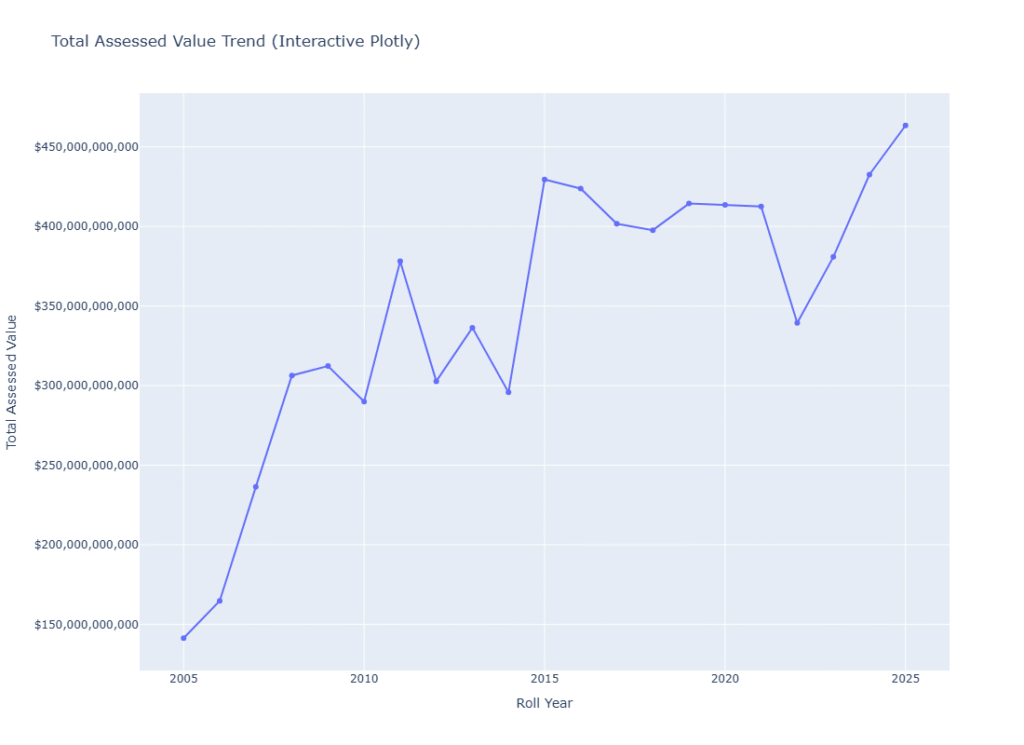
Line Chart: The Long-Term Trajectory of Assessed Value
The line chart tracks the Total Assessed Value (in ) across all residential properties from 2005 to 2025. It clearly demonstrates the volatility of Calgary’s market, showing extreme sensitivity to energy price cycles. The data reveals that the 2025 total value, at approximately $460 Billion, represents a new historical peak, surpassing the previous high set around 2015.
Figure 3 shows the Total Assessed Value Trend from 2005-2025.
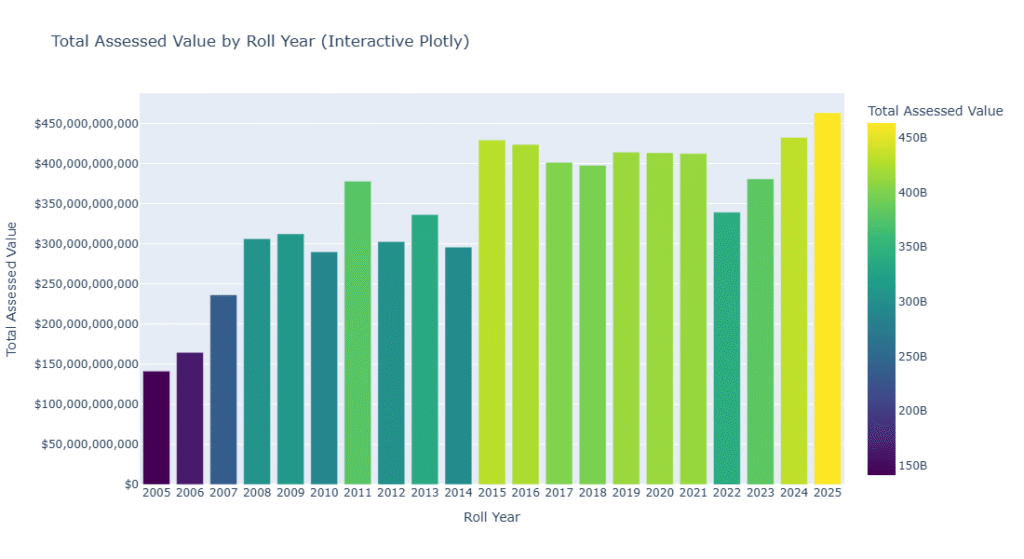
Bar Chart: Comparing Annual Growth Rates
This chart visualizes the year-over-year total assessed value. It confirms the strong momentum: the bar for 2025 is the tallest in the series, illustrating that the volume of assessed value growth this cycle is highly significant compared to any single year since 2005.
Figure 4 shows the Total Assessed Value by Roll Year.
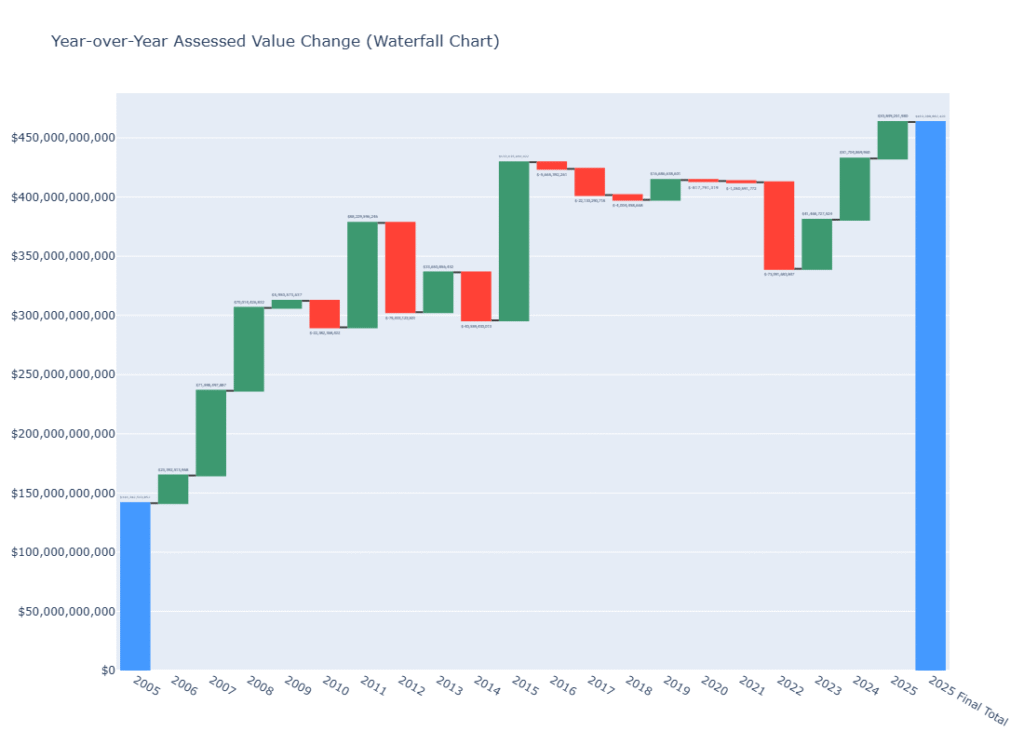
Waterfall Chart: The 2005 → 2025 Value Migration
The waterfall chart is a powerful visualization showing the cumulative change in total city-wide assessed value since 2005. It clearly highlights the years of heavy value accumulation (pre-2008 and 2023-2025), contrasted sharply with the five consecutive years of net negative or near-zero change during the 2017-2022 correction period. This visually proves how much of the current value accumulation occurred in the last five years versus the previous fifteen.
Figure 5 shows the Year-over-Year Assessed Value Change starting with the 2005 First total assessed value and ending with the 2025 Final total assessed value.
Section 4: Forecasting Calgary’s Future Value
Using time-series statistical models applied to our combined 20-year dataset, we have generated two critical forecasts for Calgary property assessments.
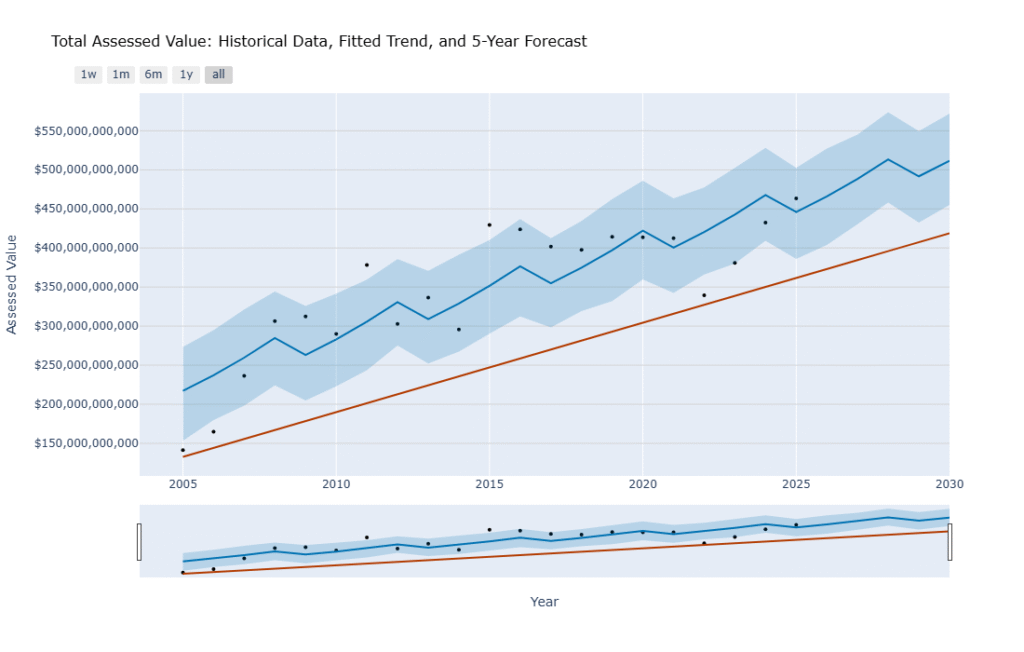
Long-Term Outlook: The 5-Year Forecast (2026–2030)
This forecast utilizes the full 2005–2025 data to predict long-term growth adjusted for structural economic changes, migration patterns, and long-term interest rate projections.
Prediction Summary:
- Average Annual Growth: We predict the average city-wide assessment growth to moderate to approximately +2.84% per year over the next five years, reaching over $500 Billion by 2030.
- Key Drivers: Forecast relies on sustained inter-provincial migration and modest diversification of the provincial economy away from the oil and gas dominance assumption. However, this time series model was based on a historical trend. There is an opportunity to explore Key Exogenous Variables (Predictors), including Economic & Market Drivers (Price Component), Demographic & Demand Drivers (Volume and Price) and Policy & Supply Drivers (Volume Component)
- Investment Zones: Growth is forecasted to be strongest in suburban master-planned communities and areas benefiting from approved infrastructure projects (LRT lines, major road upgrades).
Figure 6 shows Total Assessed Value: Historical Data, Fitted Trend, and 5-Year Forecast.
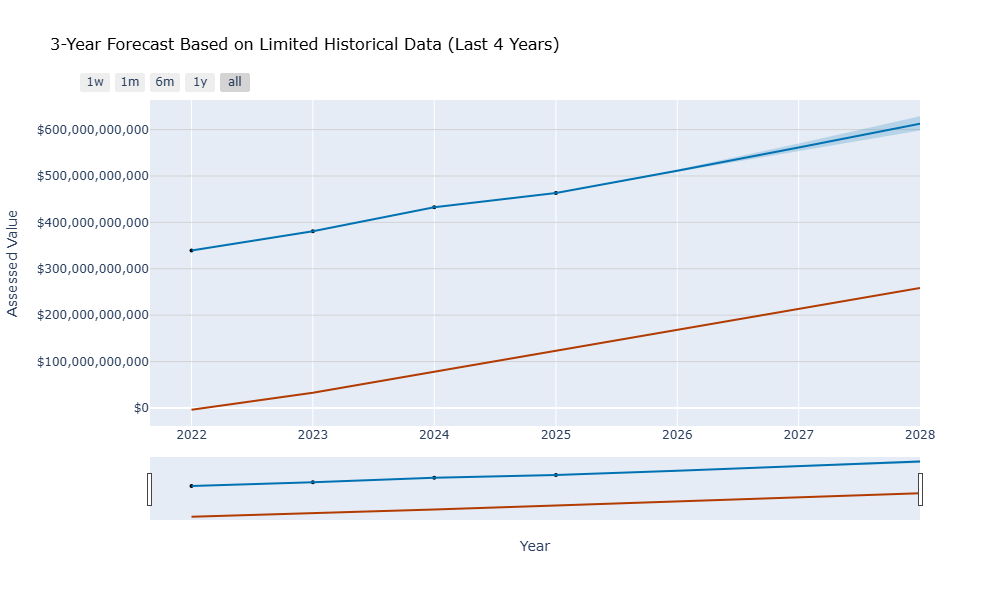
Short-Term Outlook: The 3-Year Forecast (2026–2028)
This forecast uses only the most recent and relevant data (2022–2025) to predict immediate market momentum. This analysis is more sensitive to current supply constraints and interest rate fluctuations, reflecting a high-momentum scenario.
Prediction Summary:
- Momentum: The short-term forecast shows assessment increases remaining robust but decelerating slightly from the 2025 peak, settling into the +9.11% average annual growth range, reaching over $600 Billion by 2028.
- Risk Factors: High interest rates and slow inventory accumulation pose the largest downside risks to this short-term momentum.
Figure 7 shows a 3-Year Forecast Based on Limited Historical Data (Last 4 Years).
Conclusion: Turning Analysis into Action
The 2025 assessment confirms that Calgary’s property market is experiencing significant, localized growth. The long-term data validates the resilience of the city’s housing stock across multiple economic cycles.
To truly understand the impact of these trends on your specific street or property type, you need a dynamic tool.
👉 Explore the Data: Use our Interactive Calgary Property Assessment Map to find your community, view the assessed values for every property, and see the boundary context that frames these market movements. https://cuttellanalytics.com/calgary-property-assessment-map/ or
Click Here to Analyze Your Community Now!
Want to see how your specific property stacks up, or explore assessments in your neighbourhood with an interactive tool? Stay tuned for our next article, where we unveil our interactive Calgary 2025 Property Assessment Map! You can start exploring 👉 https://cuttellanalytics.com/calgary-property-assessment-map/ before the unveiling of the web map app.
Data Source
- Current Year Property Assessments (Parcel) – https://data.calgary.ca/Government/Current-Year-Property-Assessments-Parcel-/4bsw-nn7w/about_data
- Historical Property Assessments (Parcel) – https://data.calgary.ca/Government/Historical-Property-Assessments-Parcel-/4ur7-wsgc/about_data