Visualizing Dividend Stock Data in R – RBC Stock (Step-by-Step Tutorial)
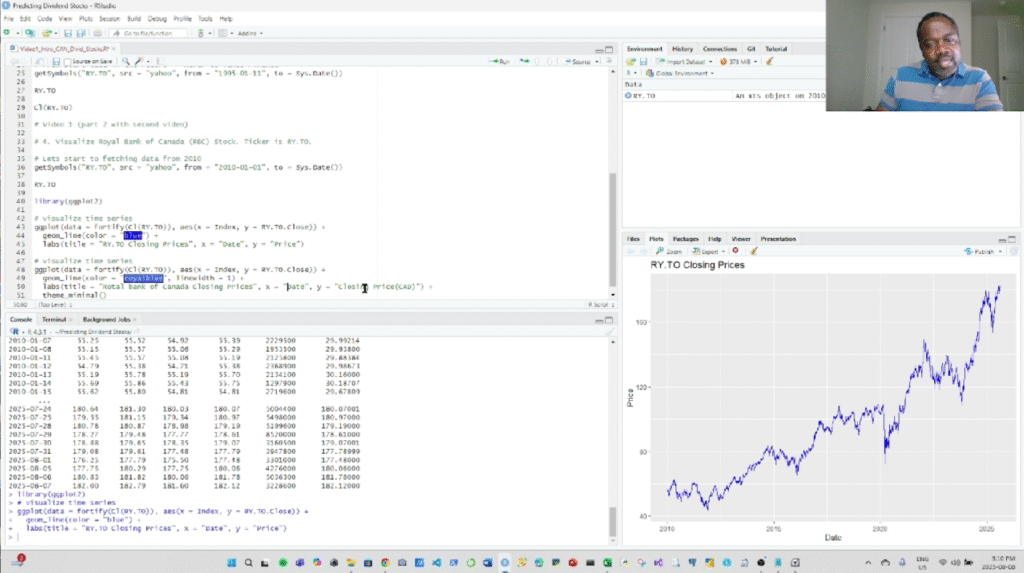
In this video, we continue from Part 1 and show you how to transform raw Royal Bank of Canada (RY.TO) stock data into a clean, professional line chart using R and ggplot2. You’ll learn:✅ How to create a time series plot of closing prices✅ How to customize chart titles, labels, and themes Whether you’re a […]
Visualizing Dividend Stock Data in R – RBC Stock (Step-by-Step Tutorial) Read More »
Canadian Stock Market, Dividend Stocks