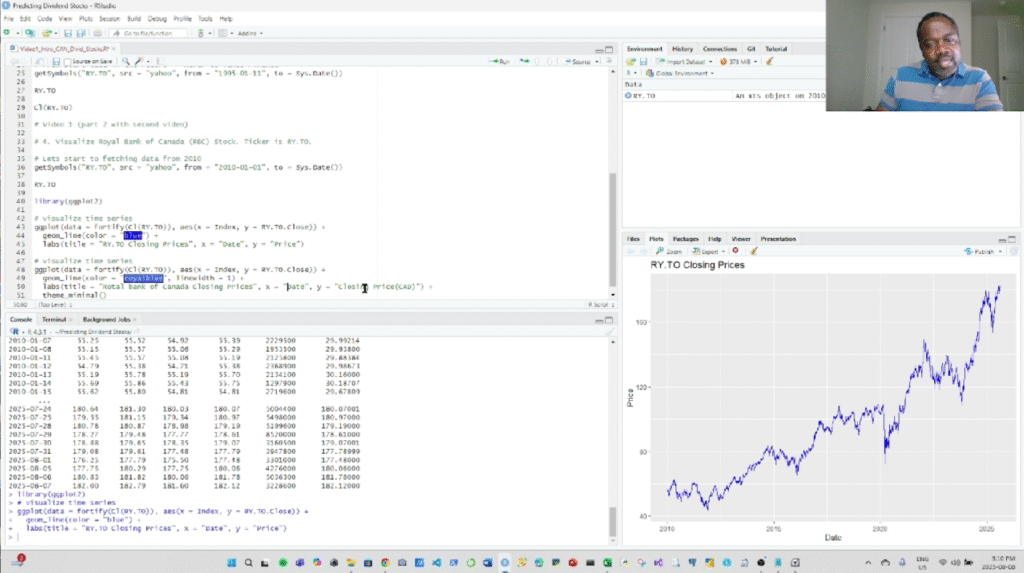
In this video, we continue from Part 1 and show you how to transform raw Royal Bank of Canada (RY.TO) stock data into a clean, professional line chart using R and ggplot2.
You’ll learn:
✅ How to create a time series plot of closing prices
✅ How to customize chart titles, labels, and themes
Whether you’re a beginner in R programming or an investor interested in analyzing Canadian Dividend Aristocrats, this tutorial is designed to be simple, clear, and practical.
📚 Get the Book: Foundations of Time Series Forecasting for Canadian Dividend Stocks
👉 Visit the Cuttell Analytics Bookstore
🔗 Watch Part 1: https://cuttellanalytics.com/introduction-to-r-programming-for-dividend-stock-forecasting/
📌 Subscribe for more:
- R Programming for Finance
- Dividend Stock Analysis
- Time Series Forecasting in R
- Canadian Dividend Aristocrats Insights
#RProgramming #DataVisualization #DividendStocks #CanadianStocks #RBC #ggplot2 #TimeSeries #StockAnalysis